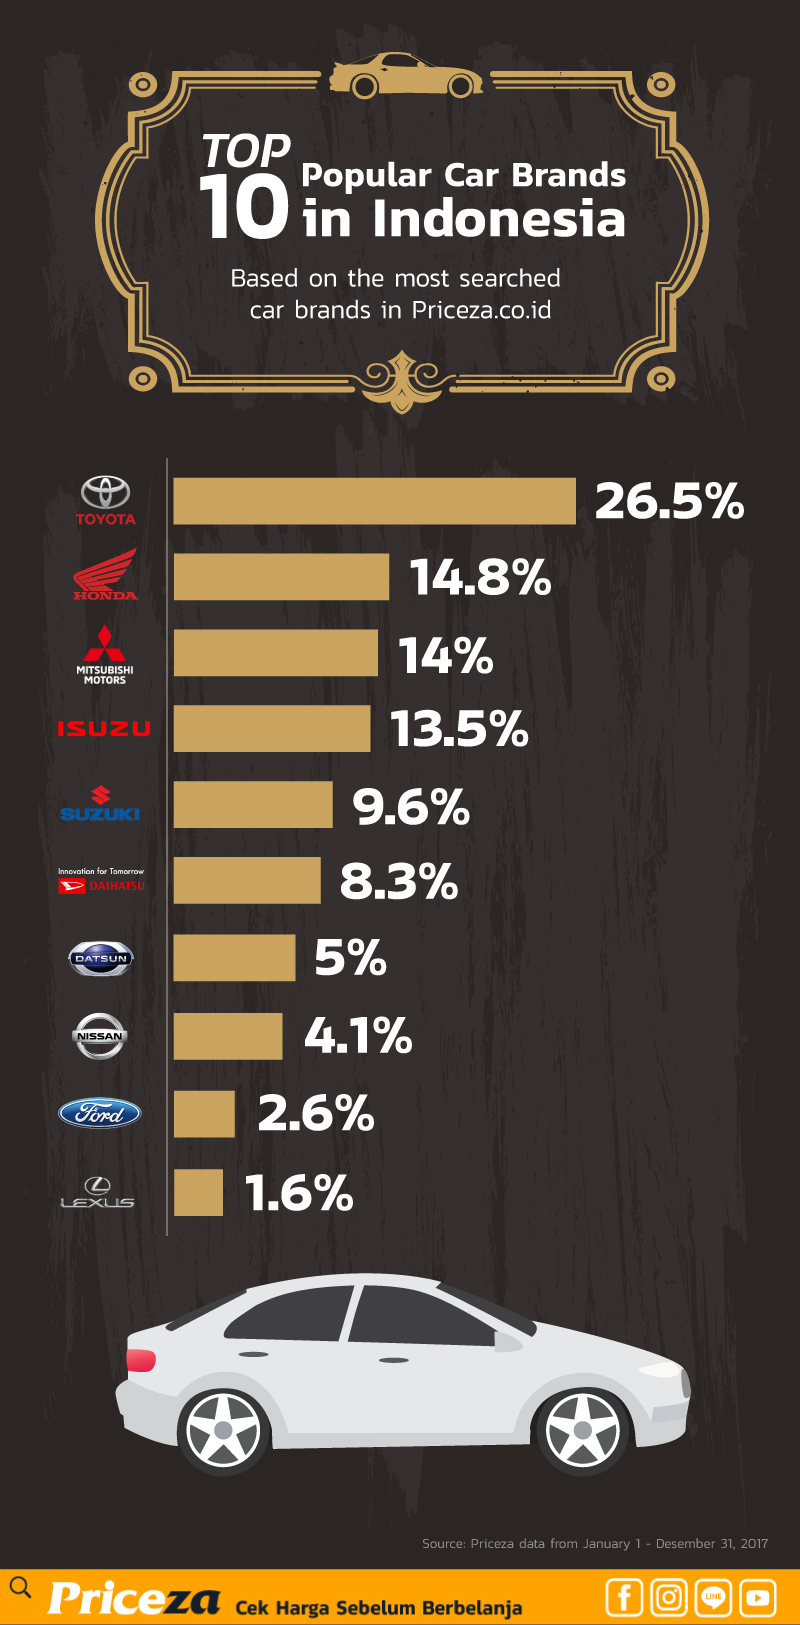
Priceza Indonesia, as one of the pioneers of the shopping search engine and price comparison platform in Indonesia, recently found the fact that Japanese car brands still dominate the most popular search among Indonesian online consumers while searching for new and used cars.
Based on Priceza findings, collected during the period of January – December 2017, the most searched new car brand is Toyota (26.5% of total search), with almost twice the percentage compared to Honda (14.8%) and Mitsubishi (14%) in second and third place.
Toyota’s dominance is consistent with sales figures released by Gaikindo, with a market share of 34.4% (371,322 units), followed by Honda and Daihatsu with 17.3% respectively. There is a difference between the third rank in terms of ‘search’ versus ‘sales’. From Priceza’s data, Mitsubishi is the third most popular brand in the search, although in the actual sales, not. Daihatsu ranks sixth for search, which is an indication that the popularity of this brand is not too high, at least in the minds of digital consumers (e-commerce).

The most popular new car model
In addition to the brand, the data collected also reveal the list of favorite car models, most searched by Indonesian consumer, during the same time period. Honda Jazz is at the top (31.9%), followed by Toyota Avanza (23.9%) and Honda HRV (16.8%). Daihatsu Xenia, is in position four (8%), with Toyota Calya and Honda Brio (6.2%) at fifth and sixth respectively, then Toyota Vios (2.7%). From the list, it is clear that Japanese manufacturers dominate the automotive market in Indonesia significantly, in terms of search, production, and sales. Honda and Toyota compete tightly as the most popular car. In general, Toyota brand is the top-of-mind when potential buyers seek information. While specifically, Honda with its specific model (especially Honda Jazz) is the most popular search.
Used car and accessory market in Indonesia
Still related to the preference of new car models, there are more interesting findings. Based on Priceza data, the most searched used car is Toyota Innova Diesel 2011, with a phenomenal percentage of 57.9%. This means, 1 of 2 people looking for used cars, specifically looking for the model. Furthermore, Ford’s EcoSport 2014 (7.9%) is the second most popular used car. With Hyundai All New Tucson 2016 (2.6%) in the seventh position, it shows that American and South Korean brands are a top competition to Japanese, in term of used cars. However, interestingly, Honda Jazz 2014 (2.6%) ‘only’ ranked 10th, compared to its top position as the most popular new car model. This shows people tend to be more interested in this model as a new car, not used.
Toyota Avanza 2014 (7.9%) shows stability in position three, not much different from its position in the new car market. While Daihatsu Xenia 2005 (2.6%) actually slumped at number 8. The presence of Toyota on the top of this list confirms the outstanding perception, that this brand does have a good market when ‘resold’. Lastly, about searching for accessories or car spare parts. Based on Priceza data, shock breaker (27.2%) is the most popular searched, followed by wheel bearings (12.3%) and coupling clutch (10.4%). This shows the priority of spare parts search in Indonesia is oriented on ‘comfort driving’ or functionality.
Before and after Lebaran become the highest car purchase time in Indonesia
Gaikindo’s statistics show the highest sales in 2017 occurred in March (102 thousand units), August (97 thousand), and November (96 thousand). This shows the tendency of the people of Indonesia to buy a car at the moment of Lebaran (Eid al-Fitr) and New Year. According to Bayu Irawan, Co-founder and Country Manager of Priceza Indonesia, “The lowest car sales figures were in June 2017, when the Lebaran Day falls. This happens not only in 2017 but also in 2016. The highest sales occurred exactly in November, August, and March.”
“Similarly in 2016, the lowest selling point occurred in July, when Lebaran is celebrated. This indicates that there is a pattern related to Lebaran. Be it pre-Lebaran, during Lebaran, and post-Lebaran. This pattern consistently occurred in previous years too.“, Continued Bayu. From these statistics, we found that the rapid rise occurred in 3-4 months before Lebaran. Significant 30% decrease during Lebaran period, followed by a drastic increase in 1-2 months later, and another increase at 2 months before the New Year.